Website Analytics: Your Google Analytics Data, Reported the Way You Need It
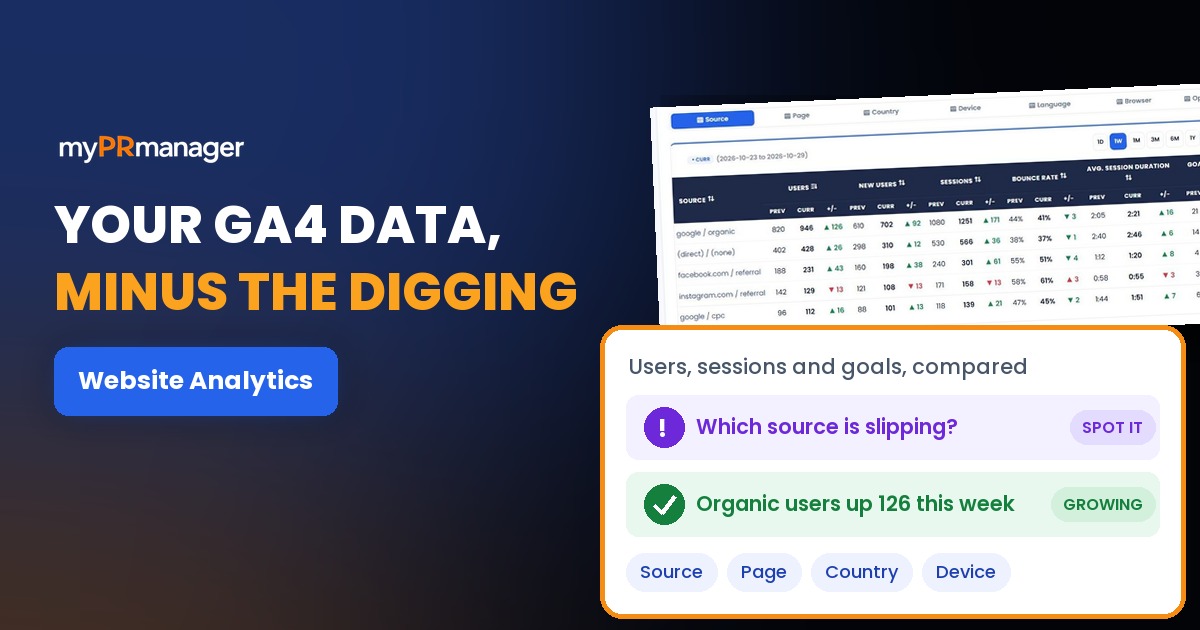
Table of Contents
- Key takeaways
- What are the key website analytics metrics?
- How Website Analytics works
- 1. Connect Google Analytics
- 2. Check the Report Summary
- 3. Compare sources, pages and more in Performance Reports
- 4. Dig into the history
- 5. Run a live check
- What to check first
- Website Analytics vs. other My PR Manager tools
- Who Website Analytics is for
- Frequently asked questions
- Does Website Analytics work with GA4?
- What's the difference between users and sessions?
- What is a goal completion?
- How is this different from Webmaster Tools?
- Can I see traffic by country or device?
- Start using your analytics
Google Analytics 4 collects almost everything you could want to know about your website visitors: how many came, where they came from, which pages they viewed and whether they did what you hoped. But getting a straight answer to a simple question, like "did traffic from Google grow this month?", often means building custom reports, changing date ranges and exporting spreadsheets. Website Analytics in My PR Manager connects to your Google Analytics account and turns that data into clear, ready-made comparison reports. See your key numbers for this period against the last, and break them down by traffic source, page, country, device, language, browser or operating system, in the same place as your other SEO tools.
Key takeaways
- Connect Google Analytics once and see your website's traffic inside My PR Manager.
- Compare users, new users, sessions, bounce rate, average session duration and goal completions with an earlier period.
- Break results down by source, page, country, device, language, browser or operating system.
- Choose comparison periods from 1 day to 1 year, with clear up and down changes.
- Run a live check for any connected website, date range and dimension.
What are the key website analytics metrics?
A few numbers tell you most of what you need to know about your website's traffic:
- Users: how many people visited.
- New users: how many were visiting for the first time.
- Sessions: how many visits there were in total (one person can visit several times).
- Bounce rate: the percentage of sessions where visitors didn't engage. Lower is usually better.
- Average session duration: how long a typical visit lasted.
- Goal completions: how many times visitors completed the actions you track, such as a purchase, enquiry or sign-up.
Each number is useful on its own, but comparing them over time and by source is what shows you what's working.
How Website Analytics works
1. Connect Google Analytics
Connect your Google account once through Google's standard sign-in and permission screen. See our guide to connecting Google Analytics and Search Console for step-by-step help.
2. Check the Report Summary
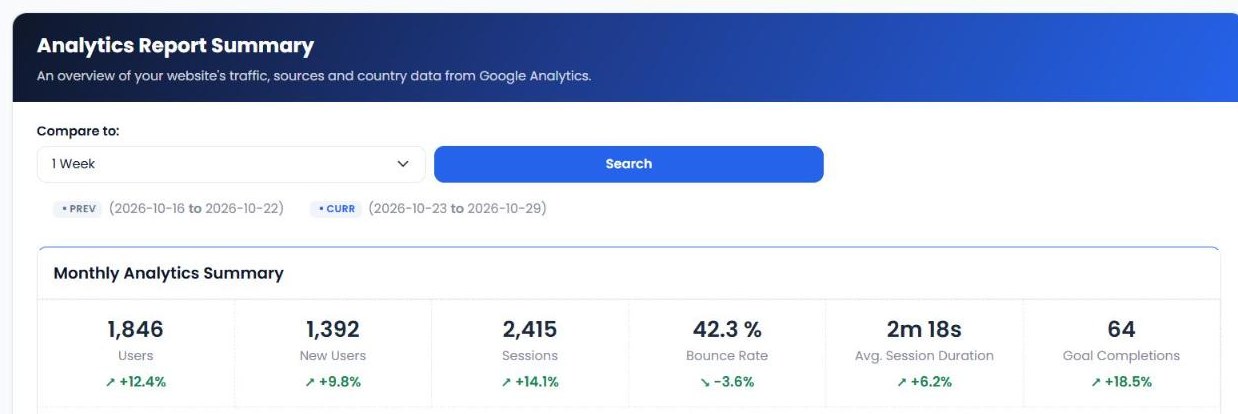
The Analytics Report Summary shows your users, new users, sessions, bounce rate, average session duration and goal completions for the current period, with the change from the previous one. Choose to compare with 1 day, 1 week, 1 month, 3 months, 6 months or 1 year earlier. Below the totals you'll find charts of users and sessions, a map of visitors by location and a breakdown of visits by source.
3. Compare sources, pages and more in Performance Reports
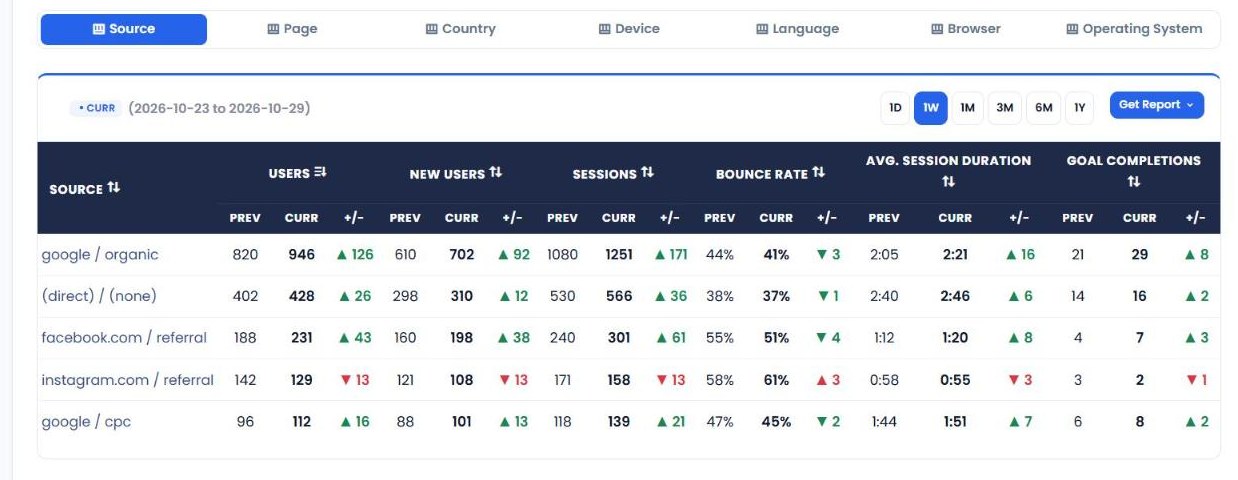
Analytics Performance Reports list every traffic source with previous and current figures for all six metrics, plus the change. Switch tabs to see the same comparison by Page, Country, Device, Language, Browser or Operating System, and search for a specific source or page.
4. Dig into the history
Detailed Reports show the day-by-day history for one source, page, country or device over the dates you choose, and Graphical Reports chart it, so you can see exactly when a change started.
5. Run a live check
Live Result Checker fetches fresh Google Analytics data for one of your connected websites. Choose a date range and a dimension (source, page, country, device, language, browser or operating system) to answer a specific question quickly.
| Report | What it shows |
|---|---|
| Report Summary | Six key metrics with the change from the previous period, plus charts, locations and sources. |
| Performance Reports | Previous vs. current figures by source, page, country, device, language, browser or OS. |
| Detailed Reports | Day-by-day history for one source, page, country or device. |
| Graphical Reports | Charts of the same history. |
| Live Result Checker | Fresh data for a chosen website, date range and dimension. |
What to check first
- Organic search traffic. Look at google / organic in Performance Reports. It's the clearest sign of whether your SEO work is paying off.
- Sources that dropped. A fall from one source, such as a social network or referral site, usually has a specific cause you can investigate.
- Goal completions by source. Traffic matters, but conversions matter more. Find the sources that bring visitors who take action.
- Pages with a high bounce rate. Check whether they load slowly, don't match what visitors searched for, or lack a clear next step.
- Mobile vs. desktop. Use the Device tab. If mobile visitors engage much less, your mobile experience may need work.
Website Analytics vs. other My PR Manager tools
| Tool | Main job | Use it when |
|---|---|---|
| Website Analytics | Report on all your website traffic from Google Analytics. | You want to know who visits, from where and what they do. |
| Webmaster Tools | Report on Google search clicks, impressions and positions. | You want to see which searches bring visitors. |
| Market Analysis | Show traffic next to markets, crypto and holidays. | You want to know if a traffic change has an outside cause. |
| SEO Dashboard | Summarise all your SEO, social and reputation data. | You want the big picture at a glance. |
Who Website Analytics is for
- Small business owners who want clear answers about their website traffic without learning GA4.
- Marketers who need to see which channels bring visitors and conversions.
- SEO consultants and agencies who report traffic to clients alongside rankings and backlinks.
- Anyone managing several websites who wants all their analytics in one dashboard.
Frequently asked questions
Does Website Analytics work with GA4?
Yes. It connects to your Google Analytics account and reports on your website's traffic data.
What's the difference between users and sessions?
Users counts people; sessions counts visits. One person who visits three times is one user and three sessions.
What is a goal completion?
It's an action you've set up to track in Google Analytics, such as a purchase, a form submission or a sign-up. Goal completions show how often visitors take those actions.
How is this different from Webmaster Tools?
Webmaster Tools uses Search Console data and covers only Google search. Website Analytics uses Google Analytics data and covers every source, including social media, referrals, ads and direct visits.
Can I see traffic by country or device?
Yes. Performance Reports have tabs for source, page, country, device, language, browser and operating system.
Start using your analytics
Your analytics data is only useful if you look at it. Sign in to My PR Manager, connect Google Analytics, and see in a few clicks which sources, pages and devices are driving your results.
Related guides: Connecting Google Analytics & Search Console · Webmaster Tools · Market Analysis · SEO Dashboard